Histogram Specification Tutorial
Histogram Specification is similar to Log or Gamma stretching, but provides additional flexibility by allowing you to specify the exact shape of the desired histogram.
- If you have not already done so, open the DG_HaleBopp.fits file in the Samples directory. (For help on opening files see the Open a File Tutorial).
- Select the Process Ribbon, Stretch panel, Histogram Specification command.
- Select the Gaussian option and click Preview.
- Since this command can significantly change the dynamic range (min and max values) of the image, you may want to adjust the Screen Stretch settings. In this case, setting the mode to Low gives pleasing results.
- This processing highlighted the outer tail of the comet, but did not saturate the inner core. Histogram specification is useful for making details visible simultaneously at greatly differing brightness levels.
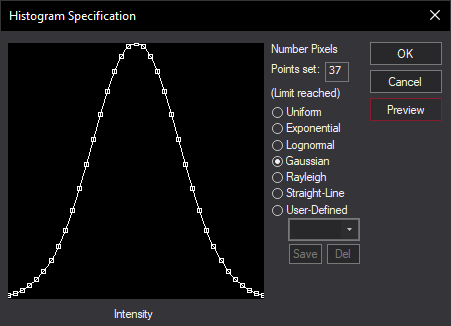
- Try experimenting with different settings, including manually-drawn histogram shapes. When drawing manually, it is often easier to start from the Straight-Line or Uniform options and then modify the graph: click on the graph shape to add a point, or move an existing point by dragging. (If you drag a point left or right past its neighbor, the neighbor will be removed automatically.)
- When you are happy with your results click OK.